Field verification of candidate wetland polygons – Southeast Isolated Wetland Assessment Study Level 2 Assessment
Note: This page describes methods and results of verification of a GIS analysis performed for the Southeast Isolated Wetland Assessment project (SEIWA), summarized here.
Overview
The Southeast Isolated Wetland Assessment Study Level 2 analysis involved field observations of wetland type and condition in NC and SC using the NC Rapid Assessment Method (NCWAM) and Ohio Rapid Assessment Method (ORAM). The NCWAM ratings allowed a relative determination of hydrology, water quality and habitat functions, and evaluated the various stressors present in these wetlands. In addition, Level 2 assessment measured the volume of each isolated wetland visited, and collected, analyzed, and compared soil samples taken from the wetlands and from surrounding uplands.
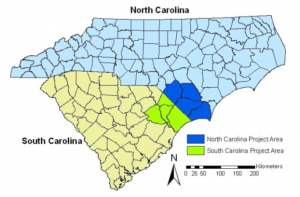
Project study area
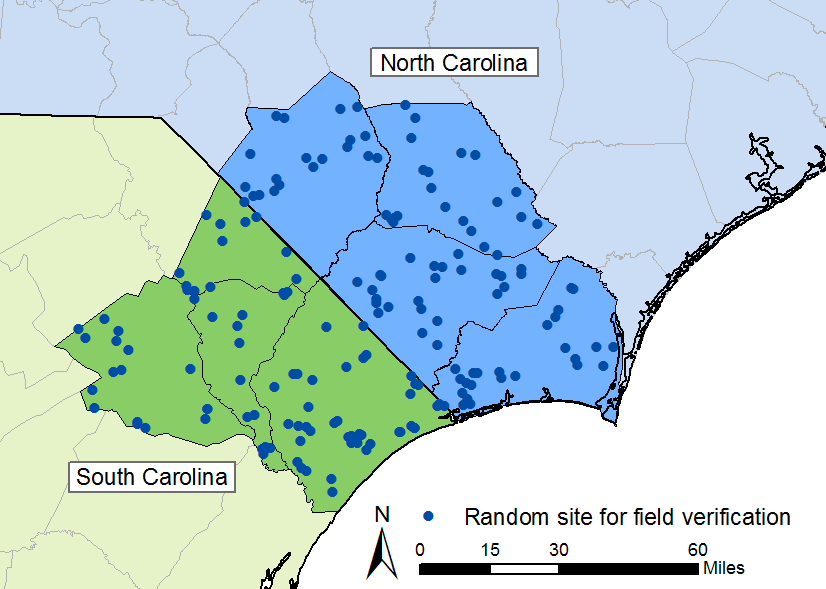
Randomly selected candidate polygon locations which were field-verified
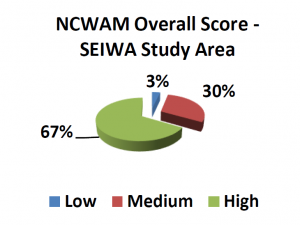
NCWAM function results for field-verified isolated wetlands
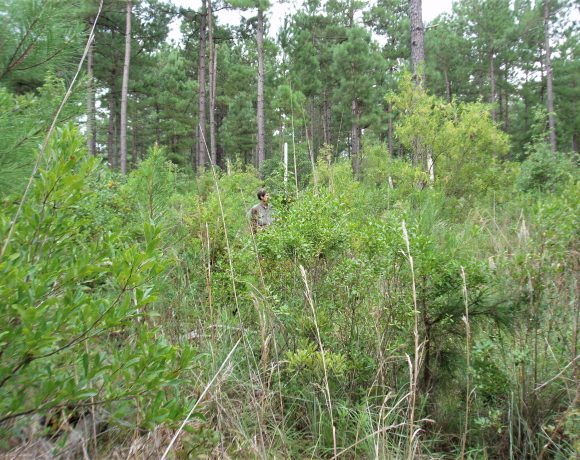
Candidate site that was confirmed to be a wetland
SEIWA Level 2 Method
A probability-based sampling design was used to randomly select 170 sites (about 21 sites per county) from the Level 1 GIS analysis for Level 2 field verification of type, condition, and function. At each of the selected sites, they were determined to be wetland or upland, and if wetland, they were assessed for connections to other water bodies to determine if they were isolated or not. If they were isolated, we collected information on their type, size, condition, and level of relative hydrologic, water quality, and habitat function.
SEIWA Level 2 Results –
Isolated wetlands are small and numerous on the Coastal Plain. We estimated there are about 52,000 isolated wetlands in the 8-county study area, with 30,000 in North Carolina and 22,000 in South Carolina. Isolated wetlands occupy 30,000 acres or about 2% of total wetland area in the study area. They tend not to be large (mean size 0.77 acre) and these wetlands are generally fairly shallow, with an average depth of 1.3 feet. The deepest one visited was 7 feet deep. Water storage capacity in an individual wetland ranged from 0.003 to 3.4 acre-ft (mean 0.20 acre-ft). We estimated that isolated wetlands can store about 4,000 acre-feet of water in the study area.
Condition and type –
The ecological condition and relative functions provided by IWs in the study area were assessed by the ORAM and NCWAM rapid assessment methods. Overall, the isolated wetlands in our study area were in fair to good ecological condition. Nearly all (98%) of the isolated wetlands scored in the top two thirds of the potential ORAM score. Also, NCWAM assessments indicated that isolated wetlands tend to function at rates typical of other wetlands in the region that were in comparable condition.
Most isolated wetlands were in good condition, and most scored high on NCWAM functions. About 50% of the isolated wetlands in our study area were forested flats (mainly pine flatwoods), with 33% being forested ponds (mainly small depression ponds) and another 16% being small pocosins.
Major Findings from verification of map accuracy
Overall, field verification of the Level 1 method found that 69% of all polygons predicted as isolated wetlands by the GIS model in the study area were in fact wetlands but only 22% were isolated wetlands. For NC, 55% of the polygons predicted as isolated wetlands by the GIS model were wetlands and 35% were isolated wetlands. For SC, 80% of the polygons predicted as isolated wetlands by the GIS model were wetlands but only 13% were isolated wetlands. The significantly lower isolated wetland success rates for SC may reflect the lower resolution topographic data available for three of the four SC counties, combined with the small size of the isolated wetlands. The GIS method was better at identifying non-isolated wetlands; however, polygons that were not wetlands were often ponds or ditches.
LiDAR data was critical to the accuracy of the predictive mapping method; 30 meter elevation data was not detailed enough to pick up many isolated wetlands. In general, available GIS datasets were not detailed enough to be good at remotely finding small ditches or streams connecting small wetland features.