Project Summary

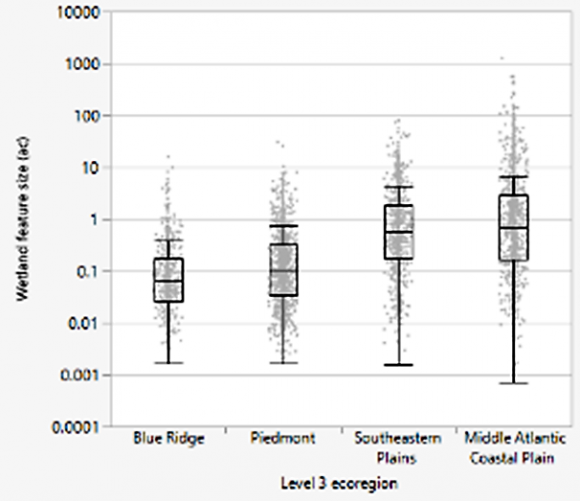
The vast majority of wetlands in the Blue Ridge Mountains and Piedmont of North Carolina are smaller than 1.0 acre in size, though these small wetlands are found in all ecoregions. The largest wetlands are found in the Coastal Plain of North Carolina, but the median size was still below 1.0 acre. Data are based on ground-truthed wetland boundaries.
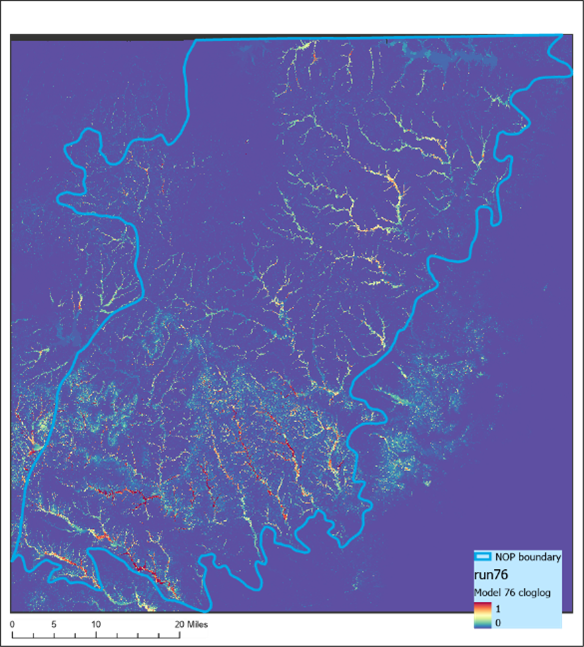
Model output from MaxEnt model in the Northern Outer Piedmont (NOP) ecoregion in North Carolina
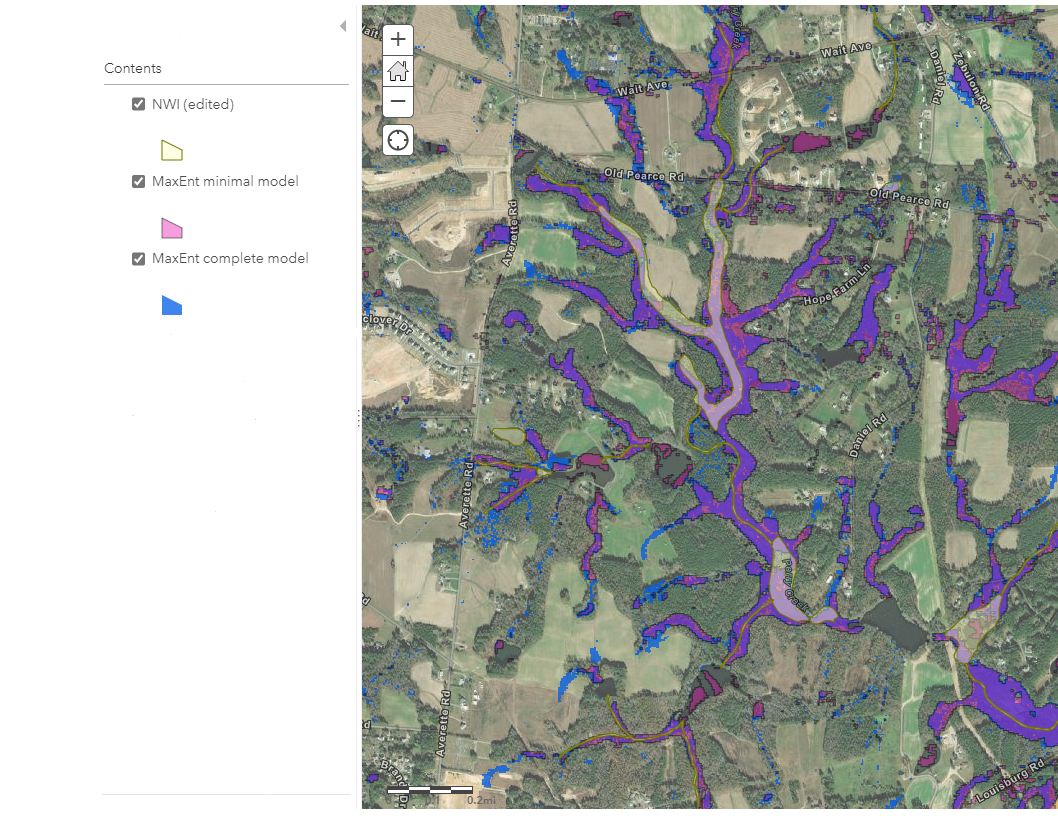
Example area showing greater prediction of wetlands with MaxEnt models than mapped by NWI
Example area showing greater prediction of wetlands with MaxEnt models than mapped by NWI (Complete model = blue; minimal model = pink, NWI = light yellow)
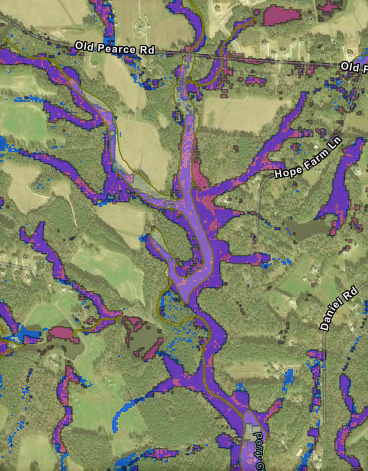
Example area showing greater prediction of wetlands with MaxEnt models than mapped by NWI (Complete model = blue; minimal model = pink, NWI = light yellow)
National Wetland Inventory (NWI) Mapping Inaccurate for Many North Carolina Wetlands
Despite being the only source of wetland maps for the state and for much of the nation, the National Wetland Inventory (NWI) has been shown to be a problematic data set for identifying wetlands in North Carolina, particularly for small wetlands which make up the majority of wetlands in the state (NCDWR 2021). Exploration of more modern approaches to predict wetland locations and extent are common in the scientific literature, including several studies in NC or adjoining states. These approaches use automated classification techniques and GIS and show potential for creating wetland maps outside the NWI framework that will be more relevant to most current users of NWI. These modern approaches take advantage of advances in GIS software, spatial data collections, and computing power over the last several decades and can be quicker and cheaper to complete than manual wetland mapping techniques. GIS- based automated classification methods reduce potential sources of bias due to human interpretation of remote sensing data, and are also repeatable, which allows for more frequent updates to the data and therefore better tracking of changes to wetland resources over time.
Prior work done by NCDWR demonstrated that inconsistent accuracy of NWI across North Carolina, when compared to field-delineated wetlands. NWI does an extremely poor job of identifying wetlands <1.0 ac. in size, and consequently NWI accuracy is very low in areas of the state where wetlands tend to small, such as the Piedmont and Blue Ridge ecoregions (NCDWR 2021). These findings were not unexpected, based on the age of the NWI data and the mapping standards used to create it (Tiner 1997). The US Fish and Wildlife Service, the creators and current stewards of the NWI, will no longer update the data set and is relying on other entities to take on that role.
NWI Updates are Problematic and Unlikely
Some states have undertaken efforts to update NWI in their areas but meeting the requirements of the wetland mapping standards for NWI updates (FGDC 2009) means that updates to NWI will continue to be problematic in many ways. For example, the mapping methods require that only wetlands >0.5 ac. in size be included on the map, and only those wetlands above that minimum mapping size be included in accuracy assessments. The mapping methods are based on those in use when NWI was first developed 40-50 years ago and require manual digitization and attribution of wetland features, which is a time-intensive – and therefore expensive – approach. The NWI mapping standards also require identification of features not commonly considered “wetlands”, such as deepwater, open water, and stream/river systems, and assignment of a wetland classification following a classification system (Cowardin 1979) that is complicated and rarely used outside of NWI, at least in NC. These additional requirements of including non-wetland habitats and assigning Cowardin classifications increase the time and expertise needed for updating NWI. All of this means that future updates to NWI have been, and will continue to be, infrequent, despite the heavy reliance of regulators and the regulated community on the data set.
Remote Identification of Wetlands Pilot Study
This research focused on assessing the utility of basic overlay and machine learning modeling methods within a spatial framework for creating maps predicting location and extent of wetlands within NC. All models were verified using ground-truthed data compiled from field delineations of wetlands and non-wetlands from several state agencies and one federal agency.
Gauging Accuracy
Producer’s Accuracy is often described as accuracy from the mapper’s perspective and describes the frequency at which a particular classification that exists on the ground is correctly identified by the map. A high Producer’s Accuracy implies a low error of omission. Conversely, User’s Accuracy represents the perspective of the map user, and is the frequency that a specific classification will be found on the ground when it is indicated on the map. A high User’s Accuracy implies a low error of commission.
Identifying NC Wetland Locations Through a GIS Overlay Approach
Seven overlay models were assessed that included unweighted overlay of all combinations of NWI, hydric soils, and topographical depressions statewide. Both the “or” and “and” approach were analyzed.
The combination of relatively high User’s Accuracy and relatively low Producer’s Accuracy values for all but the largest wetland size class indicated that most overlay models had large errors of omission for smaller wetlands. This same result was previously seen in an earlier NCDWR study that examined accuracy of NWI data for NC (NCDWR 2021). For large wetlands (>1.0 ac), the inverse was true – results suggested that nearly all of the overlay models had high errors of commission for large wetlands.
Because wetland size is strongly related to ecoregion, these results based on size class confirm that NWI, as well as hydric soils, are very likely to significantly underestimate wetlands in the Piedmont and Blue Ridge ecoregions of North Carolina mainly due to the higher prevalence of smaller wetlands in these areas, and that NWI and soils maps may be poorly suited to any projects that require identification of features <1.0 ac. in size, even when these variables are used in combination.
Our results from a “complete” overlay resulted in a Producer’s Accuracy of 81%, though the overlay model also resulted in lower User’s Accuracy from of 25% for the Coastal Plain, suggesting that although more wetlands were correctly predicted, the nwi + hydric soils + depressions overlay model also resulted in over-prediction of wetlands.
Identifying NC Wetland Locations Through Machine Learning Methods (MaxEnt models)
Maximum entropy (MaxEnt) is a machine learning method often used in data science and artificial intelligence that automates complex statistical model building. One very significant advantage of the MaxEnt approach is that it only requires presence data for model training, whereas almost all other modeling approaches require absence data as well. Absence data can be especially problematic for modeling species distributions since true absences are often difficult or impossible to identify, so this unique feature of MaxEnt has made this approach especially popular for habitat suitability modeling.
An initial complete model was run with input from 22 different statewide variables, which soil attributes (5), terrain derivatives (11), climate (3), vegetation (2), and NWI. A second model was then run (“minimal model”) after removal of covarying variables and variables with too many missing values. The final minimal model included hydric soils, vegetation community type, minimum temperature (30 year average; proxy for precipitation), elevation, sink depth, slope, topographic position index, and plan curvature (curvature perpendicular to slope), with the majority of the contributions to the model coming from the first five variables. Both models were run in a focus area, the Northern Outer Piedmont ecoregion, because of limitations on time resources available.
Both MaxEnt models resulted in very large increases in Producer’s Accuracy relative to NWI, suggesting that the MaxEnt models were capturing many more true wetlands in the landscape. General accuracy of all classifications by the minimal model were greater than NWI accuracy in all size classes.
Results showed that MaxEnt models as well as NWI showed inverse trends depending on the wetland size class, with under-prediction more prevalent in smaller features and over-prediction more prevalent in larger features. Both MaxEnt models, however, outperformed NWI in identifying smaller wetland features (<0.5 ac) based on both Producer’s Accuracy and User’s Accuracy.
Remote Identification Models Show Promise and Should be Tested Further
While results from this and other studies showed somewhat mixed results, there are indications that models developed to support automated remote identification of wetlands may be a more efficient and cost-effective method for developing more useful and current wetland maps for the state. There are a number of technical issues that could not be addressed in this project, such as spatially correlated model variables, modification of modeling parameters, and limitations with currently available geoprocessing tools. However, these preliminary results suggest that use of more “unbiased” data sources for modeling (such as DEMs) as compared to maps derived from outdated methods like manual photointerpretation may address some key weaknesses previously identified in the NWI, particularly the poor accuracy for wetlands <1.0 ac. in size. Furthermore, automated methods would be realistically repeatable on a regular basis, ensuring that available wetland maps more closely represent current conditions.
Next Steps
If funding is made available, the MaxEnt models should be run in other focus areas of the state to determine if different inputs are needed based on ecoregion to best predict wetland location. Additionally, in all focus areas, ground-truthing to verify the on-the-ground accuracy of model outputs is essential to further refine and train the models.
The need to pursue the worthwhile goal of current, accurate wetland maps has been expressed by private and public sectors alike for decades. Current wetland maps would create substantial cost savings for the regulated community, wetland regulators, NCDOT, researchers, and land managers.
References
Federal Geographic Data Committee (FGDC). 2009. “Wetlands Mapping Standard.” FGDC Wetlands Subcommittee. https://www.fgdc.gov/standards/projects/wetlands-mapping/2009-08%20FGDC%20Wetlands%20Mapping%20Standard_final.pdf
Martin, GI, Kirkman, LK, Hepinstall-Cymerman, J. 2012. “Mapping Geographically Isolated Wetlands in the Dougherty Plain, Georgia, USA.” Wetlands 32: 149-160.
NC Division of Water Resources (NCDWR). 2021. National Wetlands Inventory (NWI) Accuracy in North Carolina. NC Dept. of Environmental Quality, Raleigh, NC: NC Division of Water Resources. https://www.ncwetlands.org/project/nwi_accuracy/
O’Neil, GL, Goodall, JL, Watson, LT. 2018. “Evaluating the Potential for site-specific modification of LiDAR DEM derivatives to improve environmental planning-scale wetland identification using Random Forest classification.” Journal of Hydrology 559 (April): 192-208. https://doi.org/10.1016/j.jhydrol.2018.02.009.
Pfennigwerth, AA, Albritton, J, Evans, T. 2019. “Using Spatial Modeling to Improve Wetland Inventories in Great Smokies National Park.” Natural Resources Journal 39 (4): 482-488. https://boglearningnetwork.files.wordpress.com/2019/12/2019-pfenningwerth-et-al-using-spatial-modeling-to-improve-wetland-inventories-in-great-smoky-mountains-national-park.pdf.
Tiner, RW. 1997. “NWI Maps: What They Tell Us.” National Wetlands Newsletter (Environmental Law Institute) 19 (2). https://www.fws.gov/wetlands/Documents/NWI-Maps-What-They-Tell-Us.pdf
This work was funded by a USEPA Multipurpose Grant to North Carolina (AA-01D03020).