Developing Coefficients of Conservatism to Facilitate Floristic Quality Assessment of Wetlands in the Southeastern United States
Project Summary

Floristic quality assessment is a recognized technique for assessing habitat quality using plant species as the indicator. The Floristic Quality Index (FQI), the most widely used metric in floristic quality assessment for wetland and terrestrial ecosystems, employs a measure of conservatism (Coefficient of Conservatism, or C value) along with species richness of a plant community (N) to estimate habitat quality. The index was developed by Swink and Wilhelm in the 1970s as a method of determining habitat degradation. The FQI can be utilized in a variety of ways, including: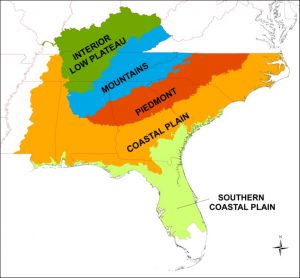
- Identifying quality natural areas;
- Comparing sites, regardless of community type;
- Monitoring natural area or restoration site quality through time;
- Comparing mitigation sites to reference sites; and
- Assisting in habitat restoration and informing mitigation policy.

Coefficients of Conservatism values (C values) range from 0 to 10, and rate an individual plant species based on its ability (or lack thereof) to tolerate human-caused disturbance to its habitat. Plant taxa that are obligate to high quality natural areas are given high C-values (9 or 10), whereas taxa typically found in a wide variety of habitats and that are tolerant of unnatural disturbance are assigned low C-values. Non-native taxa receive a C-value of zero.
Before this project was undertaken, C values had not been developed for much of the Southeast. To create this database, we assembled 15 expert botanists from across the Southeast to generate C-values for wetland plant taxa. The resulting database includes C-values for 2,523 wetland taxa, across five separate ecoregions, totaling over 7,100 C-values available for floristic quality assessment. A large portion (51%) of native wetland taxa are intolerant of disturbance (C-value >7), while tolerant taxa (C-value <3) comprise only 9% of native wetland taxa of the Southeast. This carries implications for wetland conservation and restoration in the Southeast.
Online FQI Calculator:
C value databases developed for this project were also uploaded by ecoregion to the Universal FQA Calculator website (Freyman et al. 2016).
The Coefficient of Conservatism represents a species’ ability to tolerate anthropogenic alteration. It does not address a plant species’ response to natural disturbance such as fire or flooding. A plant species that requires a high frequency of natural disturbance may receive a high C-value, if it shows a low tolerance of anthropogenically-driven habitat alteration. While there is a loose correlation between rarity and high C-value, rarity alone is not an indicator of a species tolerance to alteration, and therefore was not relied upon in the development of C values.
C value 0-1: Taxa able to adapt to severe anthropogenic habitat alteration, occurring so frequently that often only brief periods are available for growth and reproduction of the species. These species are also able to colonize areas with high degrees of anthropogenic alteration. Many also do well with severe natural disturbance, but most occurrences are in heavily altered areas. (Zero confidence that a specimen brought into an herbarium was collected from a remnant or high-quality natural area.) Non-native and adventive species (species that have arrived in a new location on their own or with human help) are automatically assigned a C-value of zero.
C value 2-3: Taxa associated with somewhat more stable, though degraded, environments.
C value 4-6: Taxa that persist with moderate alteration, but which decline with more intense, long-lasting, or frequent anthropogenic alteration. Many are also present in natural areas, and may be dominant or matrix species with broad habitat tolerance. (A specimen brought into an herbarium may be from either a high-quality natural area or from a moderately altered site).
C value 7-8: Taxa associated mostly with well-established natural areas, but that can be found persisting where the habitat has been somewhat degraded.
C value 9-10: Considered to be restricted to high-quality natural areas, including those which show high frequencies of natural disturbance such as flooding or fire. These species usually exhibit a high degree of fidelity to a narrow range of habitat requirements, but may be tolerant of a broader range of high-quality natural habitats. (Nearly 100% confidence that a sample brought into an herbarium was collected from a remnant or high-quality natural area.)
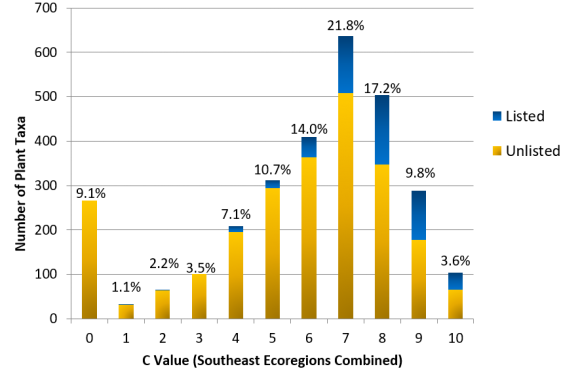
Distribution of C-values for wetland plants in the Southern Coastal Plain ecoregion, with information on proportions of species listed as threatened, endangered, or species of special concern. Native wetland plants in the Southeast tend to have high C values.
References:
Freyman, W.A., L.A. Masters, and S. Packard. 2016. The Universal Floristic Quality Assessment (FQA) Calculator: an online tool for ecological assessment and monitoring. Methods in Ecology and Evolution 7(3): 380–383
Swink, F. and G. Wilhelm. 1979. Plants of the Chicago Region, 2nd Ed. Morton Arboretum, Lisle, IL. 922pp.
This project was funded by a grant from the US Environmental Protection Agency (CD-96488511) and matching funds from the NC Department of Environmental Quality.