Assessment of Change in North Carolina’s Outer Coastal Plain Wetlands
Project Summary
Wetlands everywhere hold tremendous value to humans and wildlife, economically, ecologically, culturally and recreationally. In North Carolina, the majority of the state’s wetlands are located in the eastern third of the state, in the Coastal Plain ecoregion. Their location is part of their value, as they interface with coastal waters and provide refuge for commercially important fish and shellfish, as well as buffering from storms, water filtration, and recreational and aesthetic benefits. However, wetlands in the Coastal Plain, especially freshwater wetlands, also face challenges with sea levels rising and storm surges from hurricanes increasing. To assess on-the-ground vegetative changes and trends in these wetlands, North Carolina Department of Environmental Quality (NCDEQ) Division of Water Resources (DWR) analyzed historical and resampling data from 78 wetlands of various types across the Outer Coastal Plain of North Carolina. These sites included a combination of 36 wetlands resampled by the DWR wetland science team and 42 others resampled by project partners for other projects. Vegetation community data were collected from all sites, with soil and water chemistry data collected from a subset of sites.
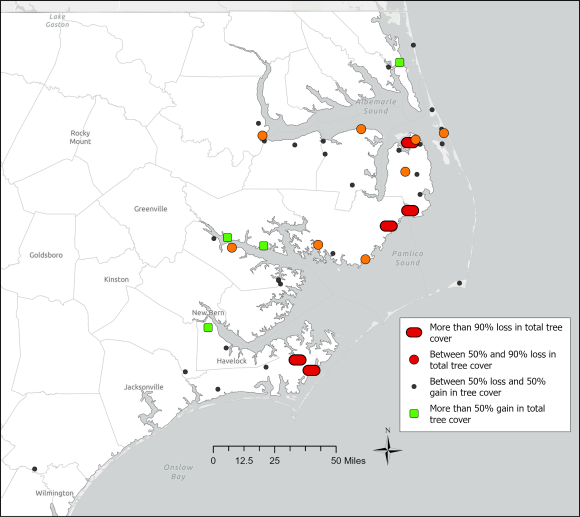
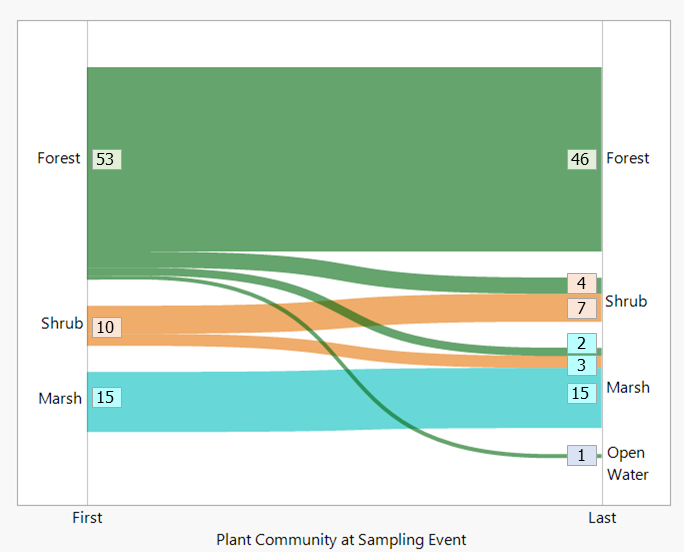
Freshwater and transitional salinity wetlands changed in a larger number of vegetative community aspects than brackish wetlands. Overall, wetland sites assessed in this study gained nonnative species (richness and cover), lost floristic quality, gained brackish tolerant species and coverage by those species, and lost shrub and tree cover while gaining herbaceous species. Forested wetlands showed the most changes in plant communities, particularly in terms of greater invasion by nonnative taxa and decreases in vegetation compositional quality (mean C). Cover of shrub, tree and vine taxa also decreased. Mapping trends in total tree taxa cover indicated a decrease all around the edges of the Albemarle-Pamlico Peninsula, as well as near the south end of the Pamlico Sound. Of the 66 forested and shrub wetlands with tree cover data available, just under 20% (13) lost more than 50% of their tree taxa cover between first and last sampling, with five (5) of these sites experiencing a greater than 90% reduction in their tree cover. Another 6% (4) gained more than 50% tree taxa cover between sampling events. Ten (10) sites, or 13%, completely changed community type – always from a more forested or woody type to less forested type. These losses in wetland tree cover are clearly seen around the North Carolina coast in the phenomenon of “ghost forests,” with evidence of a past forest remaining for a time before full transition to brackish marsh.
The main nonnative species driving changes in freshwater forested wetland plant communities were Japanese honeysuckle (Lonicera japonica) and Japanese stiltgrass (Microstegium vimineum), which both had more frequent occurrences. Shrub and marsh wetlands appeared to change less than forested wetlands, although the nonnative common reed (Phragmites australis) increased in occurrence frequency between original sampling and resampling in marsh wetlands.
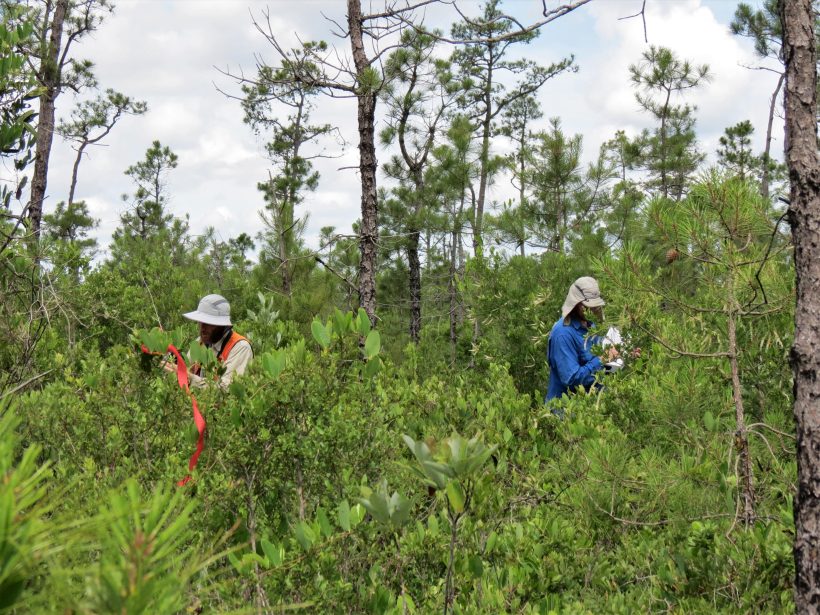
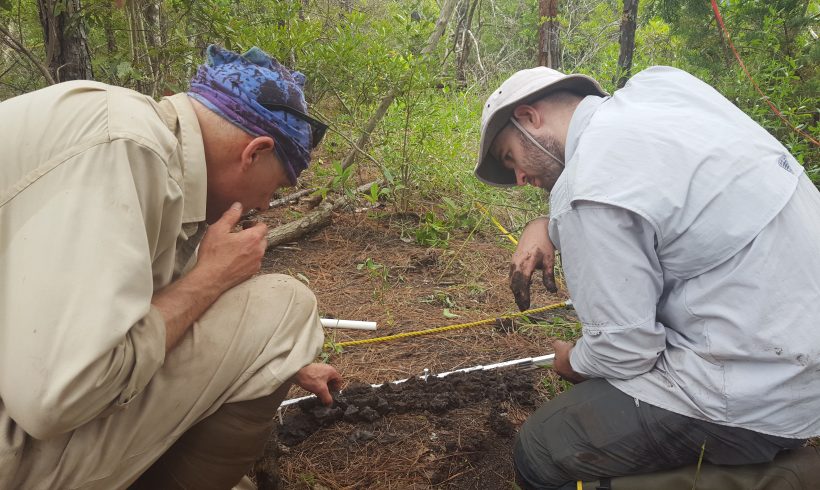
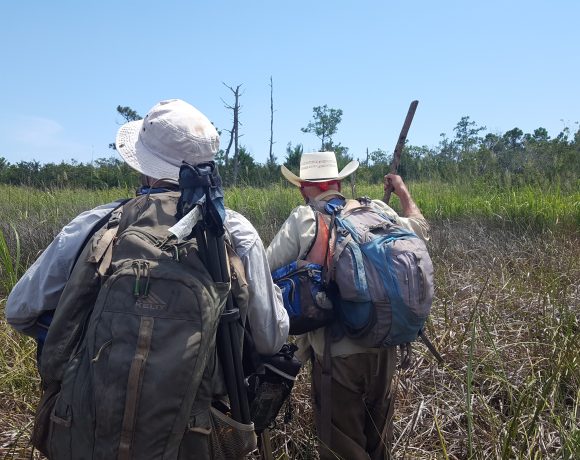
Freshwater and transitional salinity wetlands, but not brackish wetlands, showed significantly greater invasion by nonnative species and reductions in floristic quality. Brackish wetlands did, however, show a significant reduction in herbaceous cover between sampling events, possibly due to increased flooding by seawater. Freshwater forested wetlands showed recruitment of new individuals of woody species between original and resampling, but transitional salinity forested wetlands showed a drop in woody species recruitment between sampling events. Additionally, larger size classes of trees were represented in the freshwater forested wetlands, but they were generally missing in the transitional forested wetlands during original sampling and more so during resampling.
We used data on the entire wetland plant community to predict a community changepoint threshold based on soil sodium. The threshold was correlated with shallow groundwater salinity and specific conductivity, which could potentially be used as proxies for soil sodium. Freshwater vegetative communities are potentially able to tolerate exposure to salinities between about 0.3 and 0.5 ppt, but our threshold analysis suggests that at a minimum, chronic exposure above 0.5 ppt can precipitate changes in the understory community in freshwater wetlands, where certain species clearly decrease in frequency of occurrence and certain other species increase. Groundwater salinity and specific conductivity are easily measured with water quality meters and could potentially be used as proxies for lab soil analysis of soil sodium. Surface water salinity was not well correlated with soil sodium, so should not be used as a proxy for soil analysis.
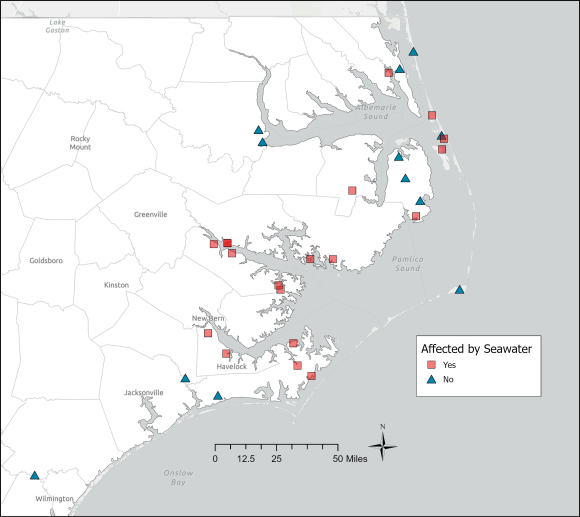
Nearly two-thirds of the 32 DWR sites with water chemistry data were categorized as “affected by seawater” based on water quality data chloride (Cl) ion concentrations greater than 100 mg/L, after Kelly (2005) and Konikow and Reilly (1999). Chloride ion concentrations were significantly positively correlated with other elements of seawater including bromide (Br), calcium (Ca), potassium (K), magnesium (Mg), sodium (Na) and sulfate (SO4). Sites in the “affected by seawater” category had significantly higher top horizon soil sodium, higher salinity, greater changes in the composition of woody plant communities over time and higher proportions of brackish tolerant species, as well as cover by them. Therefore, a surface or groundwater sample chloride ion concentration over 100 mg/L was determined to be a good indicator of the presence of seawater, when chloride is also correlated with other components of seawater. Based on chloride ion concentrations, sites with surface or shallow groundwater salinities at 0.3 ppt or above could be considered impacted by seawater, if chloride ion concentrations are correlated with other elements of seawater.
Given the changes occurring in transitional salinity forested wetlands in particular, detection of freshwater coastal wetlands that are vulnerable to change, or affected by seawater, is imperative. Loss of forested freshwater wetlands comes with a loss of the tremendous value they provide to humans and wildlife – economically, ecologically, culturally and recreationally. Lack of recruitment in coastal forested wetlands is a concern that warrants attention through further research, management of existing areas, restoration of historical wetland areas and creation of new wetland areas. Indicators of seawater intrusion could be used to detect sites that are unimpacted or have been minimally impacted by seawater, presenting an opportunity to conserve, protect and restore these existing coastal forested wetlands. Priority could also be put on conserving land upslope of these important wetlands, as well as proactively managing them for future sea level rise.
Example of a freshwater forested wetland that did not change significantly between 2012 and 2022
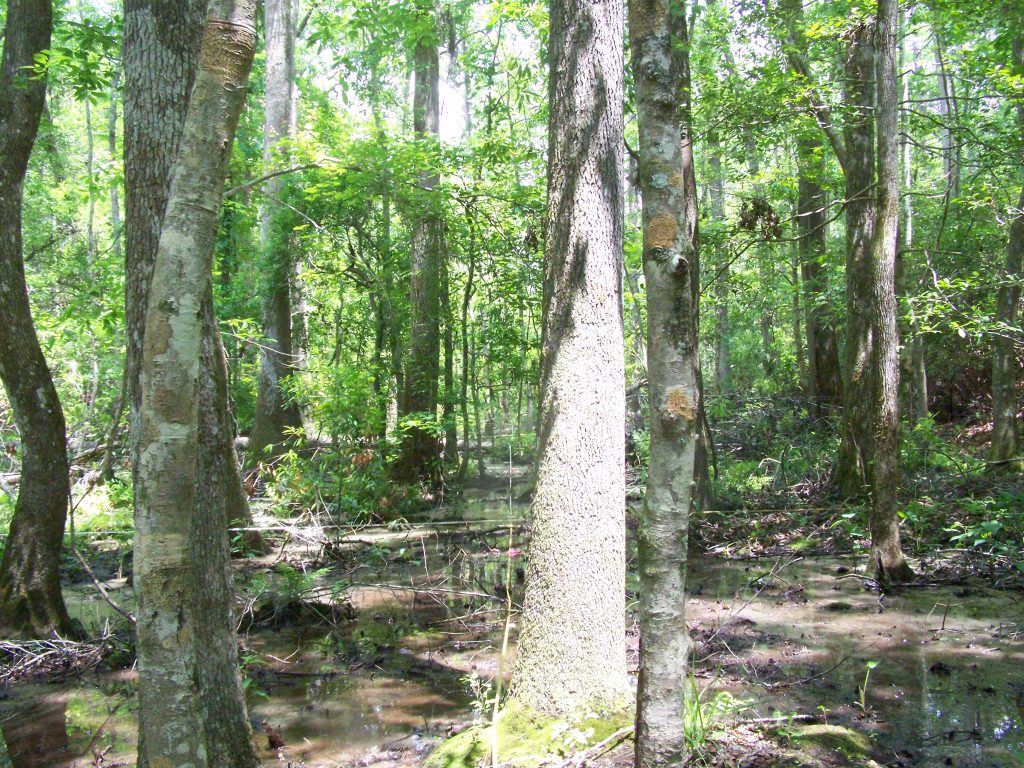
Lewis Gut, Beaufort County - 2012
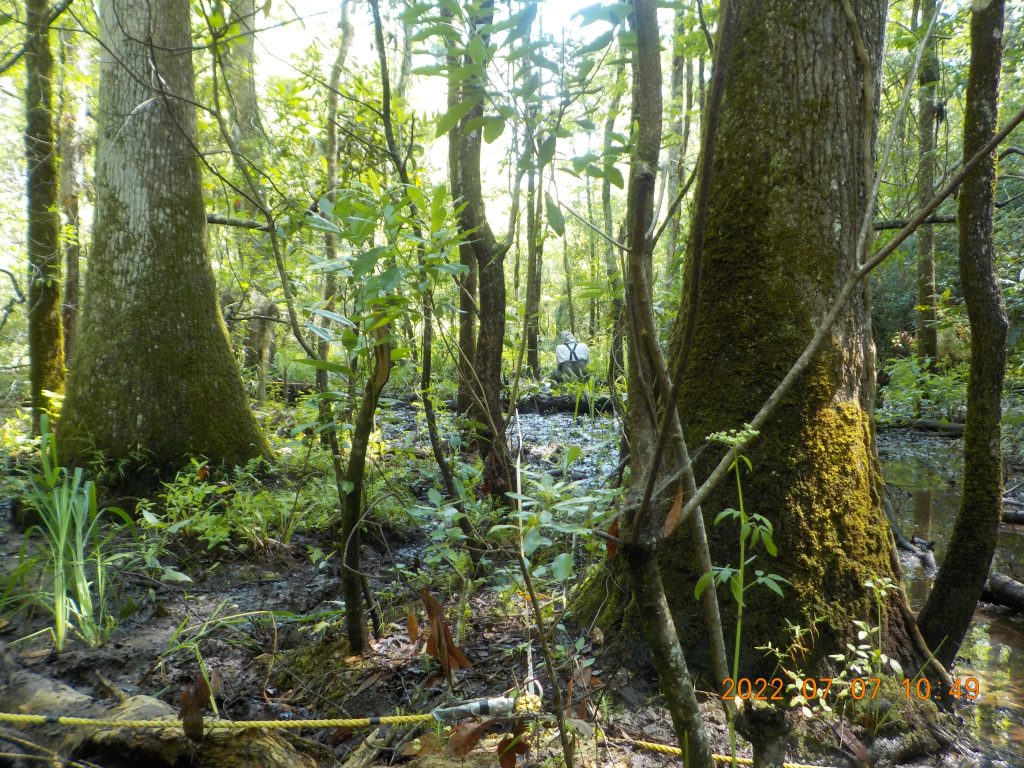
Lewis Gut, Beaufort County - 2022
Example of a freshwater forested wetland that changed significantly between 2007 and 2022
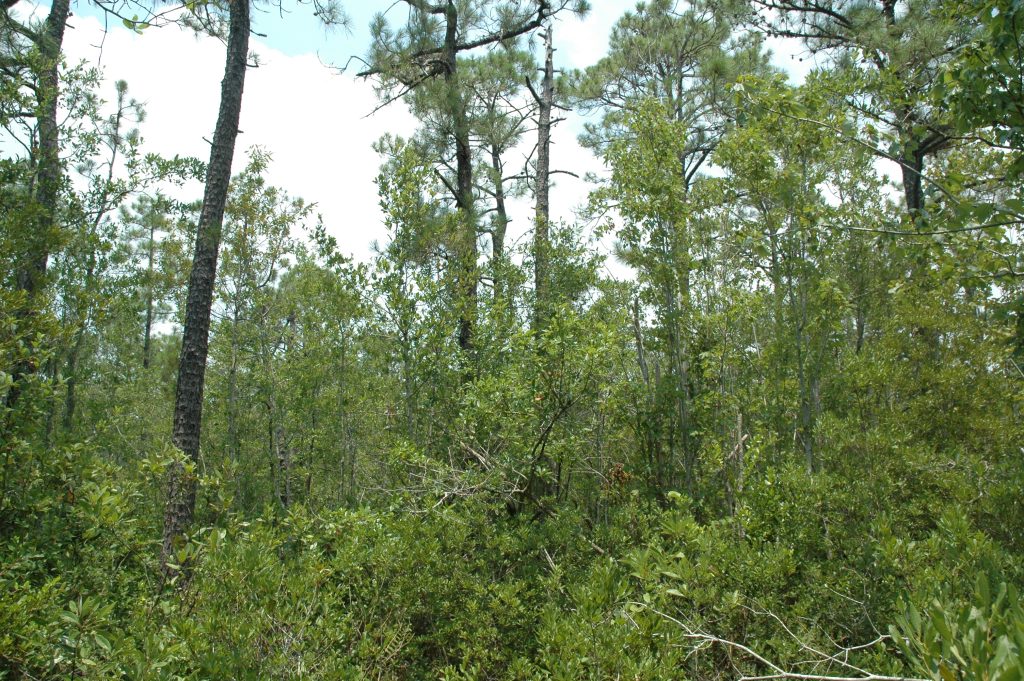
Brett Bay, Carteret County - 2007
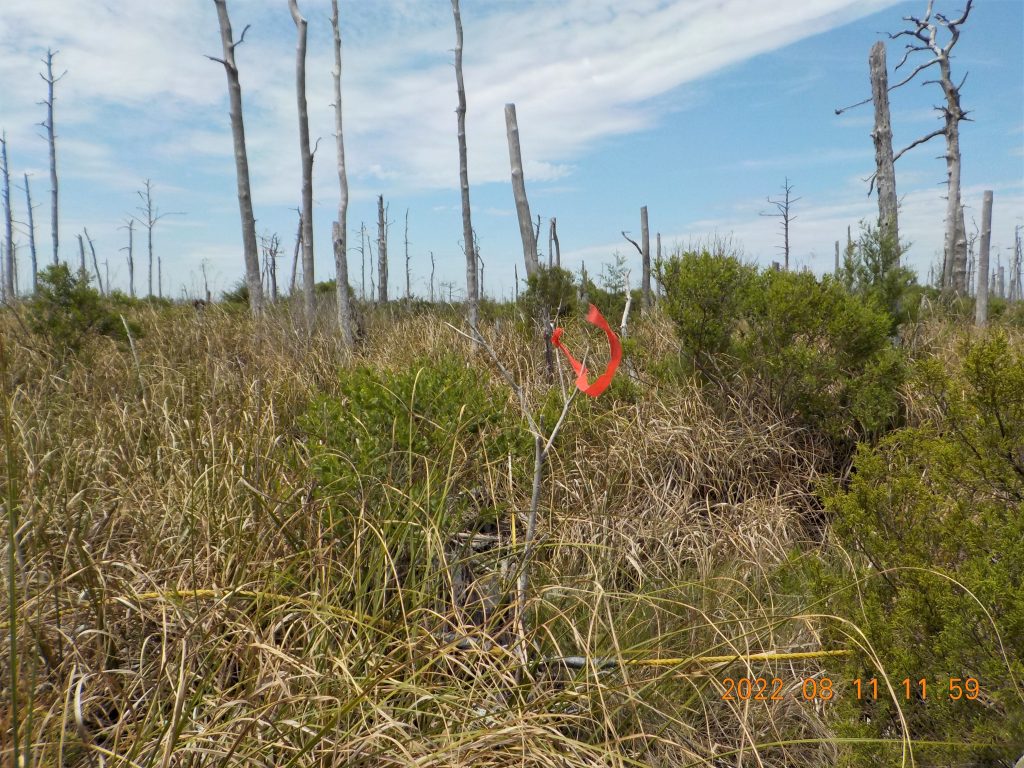
Brett Bay, Carteret County - 2022
This work was funded under EPA Wetland Program Development Grant Cooperative Agreement CD00D98120 and matching funds from the NC Department of Environmental Quality.
Citations:
Kelly, D. 2005. Seawater Intrusion Topic Paper. Island County WRIA 6 Watershed Planning Process document. Accessed on Sept. 28, 2023 at https://apps.ecology.wa.gov/publications/documents/1203271.pdf
Konikow, L., and Reilly T. 1999. Seawater Intrusion in the United States. In: Bear, J., Cheng, A., Sorek, S., Ouazar, D., Herrera, I. (eds) Seawater Intrusion in Coastal Aquifers — Concepts, Methods and Practices. Theory and Applications of Transport in Porous Media, vol 14. Springer, Dordrecht. https://doi.org/10.1007/978-94-017-2969-7_13

