Southeast States Wetland Monitoring Project – Riverine Forested Wetlands
Project Summary
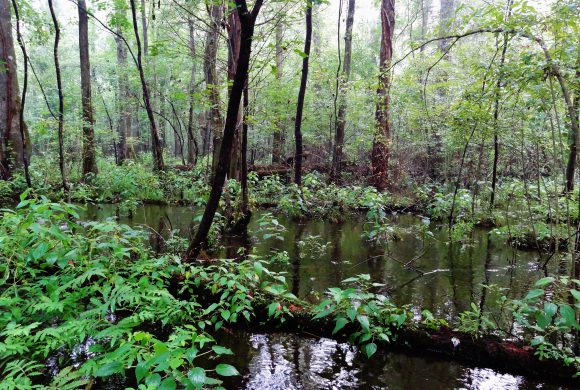 Riverine swamp forest
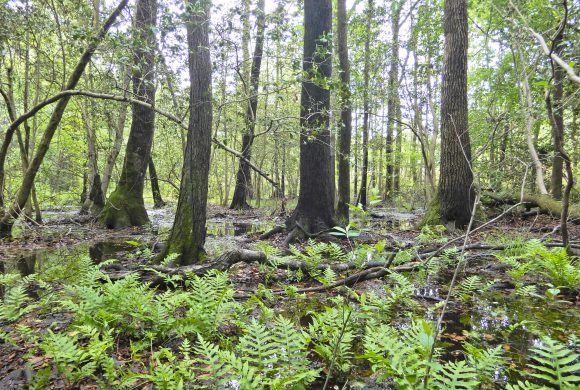 Bottomland hardwood forest wetland
4 states, 90 wetlands, 33 field biologists
In the first of its kind, this large multi-state collaborative project was intended to augment data collected during the first National Wetland Condition Assessment in 2011. Under North Carolina’s lead, a Southeast regional intensification study was undertaken to sample 90 forested wetlands across four states: North Carolina, South Carolina, Georgia, and Alabama. Intensive data were gathered in 2012 from wetland sites chosen from the randomly selected potential National Wetland Condition Assessment sites. Efforts were focused on two types of forested wetlands: bottomland hardwood forests, which are found at low elevations with little to no water running through them, and riverine swamp forests, which tend to be directly adjacent to a large stream or river.
Data were collected at all three of the EPA’s wetland assessment levels – Level 1 (landscape analysis on a desktop), Level 2 (on-the-ground rapid assessments), and Level 3 (intensive site assessment using multi-parameter field data). The Level 1 desktop analysis involved calculating watershed and buffer disturbance levels using the Landscape Development Intensity (LDI) index (Brown and Vivas 2005). Rapid assessments (Level 2) were conducted using the North Carolina Wetland Assessment Method (functional assessment tool), Ohio Rapid Assessment Method (assesses habitat quality), and USA Rapid Assessment Method (focused on stressors present). Level 3 data collection involved detailed sampling and recording of vegetation, soils, water quality, hydrology, amphibians, and macroinvertebrates.
Results
Rapid assessments
Predictive validity of wetland rapid assessments
Regression analysis compared the rapid assessment data to the Level 3 intensive survey data. Each of the rapid assessments used in this study were predictive of levels of intensively surveyed wetland parameters (e.g., soil chemistry, water chemistry, vegetation, amphibians, and macroinvertebrates). For example, an NCWAM rating of “low” function was directly related to low macroinvertebrate diversity and low vegetation quality. Similarly, a high ORAM score was able to predict better water quality values (e.g., low fecal coliform, low water nutrients, high macroinvertebrate diversity). This finding increased confidence in the ability of rapid assessments to indicate condition or quality of forested wetlands in the Southeast.
Vegetation Quality:
SC, GA, and AL forested wetland vegetation was consistent with that associated with high quality habitats. Vegetation in NC’s forested wetlands was not as high quality as in wetlands in the other three states. North Carolina’s forested wetlands generally had greater numbers of nonnative plant species with greater percent cover than the other three states.
Amphibians:
19 species of frogs and toads and 12 species of salamanders were detected in these Southeast forested wetlands. The most common frog was the northern cricket frog and the most common salamanders were the marbled salamander and the spotted salamander.
Macroinvertebrates:
Over 225 different taxa of macroinvertebrates were recorded. The most common was the freshwater isopods, Caecidotea spp. and Asellus spp. A large number (73) of taxa were rare at the sites (only one individual was observed). Wetlands in all four states showed high levels of macroinvertebrate diversity.
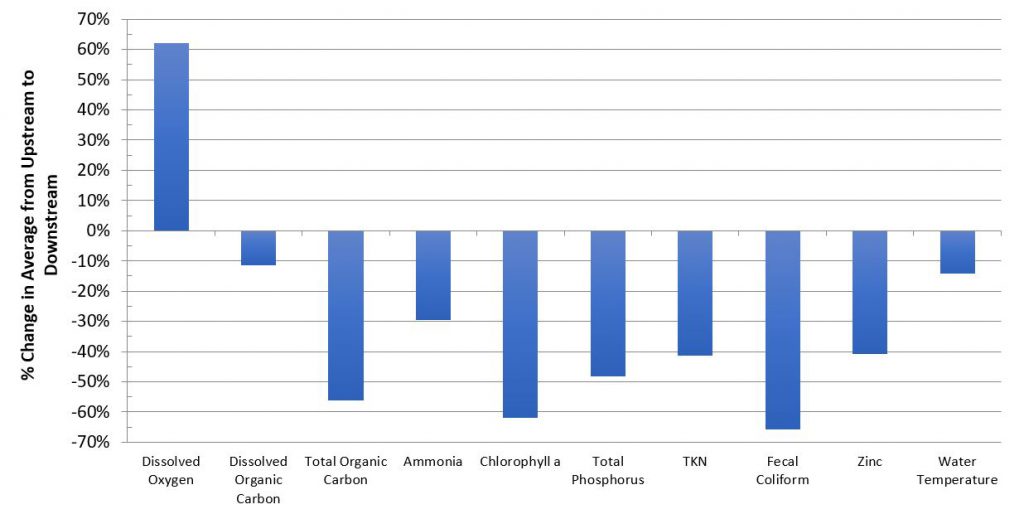
Water quality
Significant improvements in water quality from upstream to downstream were observed in riverine swamp forests for the following parameters: dissolved oxygen, total organic carbon, ammonia, chlorophyll a, total phosphorus, total nitrogen, fecal coliform, zinc, and water temperature. Dissolved oxygen was higher leaving the wetlands, and the other parameters were lower leaving the wetlands.
 Overall wetland condition:
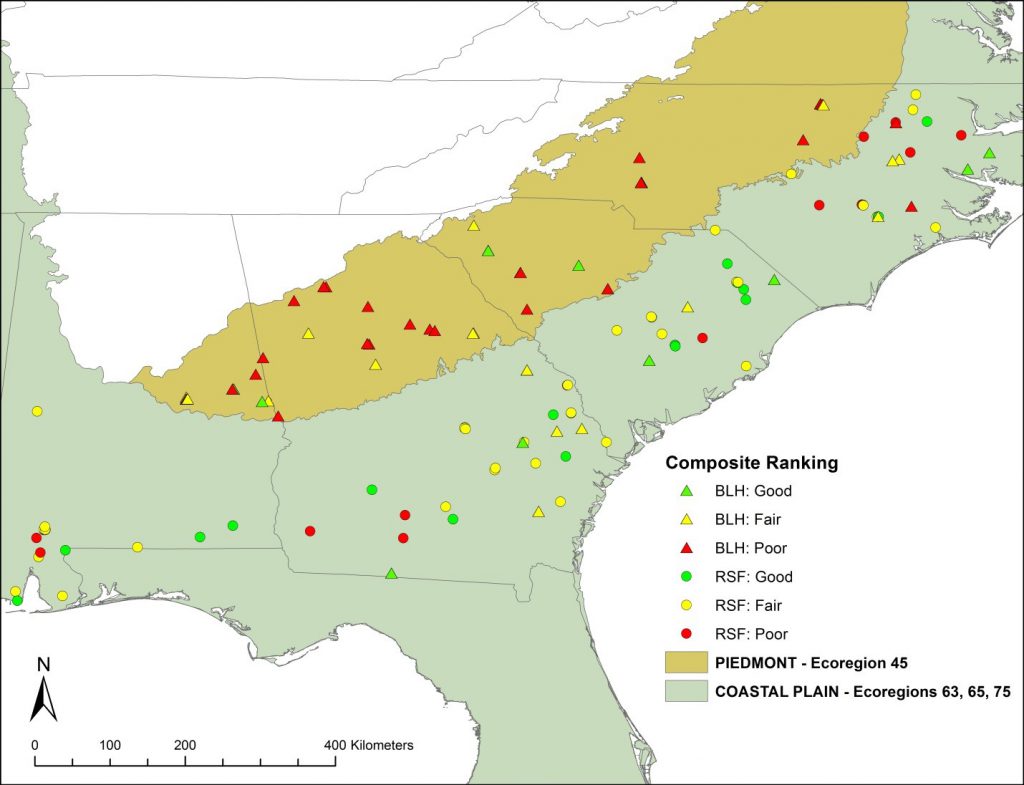
A multi-metric index of wetland condition was developed for this project, which incorporated all rapid assessments, LDI within a 300 meter buffer, amphibian quality ratings, macroinvertebrates, vegetation, soil metals, and nutrients in water samples. This multi-metric index was used to place sites into categories of good, fair, and poor. Because sites were randomly selected, they were presumed to span the spectrum of disturbance and quality. Results of this categorization of sites showed inland Piedmont forested wetlands to be in fair or poor condition, in contrast to Coastal Plain forested wetlands, which were in better condition. North Carolina’s wetlands were overall in worse condition than South Carolina, Georgia, and Alabama’s wetlands.
Acknowledgements:
The accomplishment of this project was the result of a huge collaborative effort between four states, involving 33 different field biologists collecting data and several others analyzing data, writing, and reviewing the final document. Many thanks to all who participated.
This project was funded through EPA Region 4 Wetland Program Development Grant (CD95449910), EPA National Headquarters funds, and matching funds from each respective state agency involved.
Citation:
Brown, M.T., & Vivas, M. 2005. Landscape Development Intensity Index. Environmental Monitoring and Assessment. 101:289-309.