Performance of Rapid Floristic Quality Assessment Indices for Increasing Cost-Effectiveness of Wetland Condition Evaluation
Project Summary
This project tested whether rapid floristic quality indices can be used in North Carolina’s diverse wetlands, given the many cost-saving benefits that can be realized from using such indices. Vegetation plot data previously collected (by NC Division of Water Resources and others) from 2,292 North Carolina sites were analyzed to calculate and test how well two floristic quality assessment indices based on dominant species could predict a full index based on a comprehensive species list. Dominance was defined by percent cover of each species within a study plot.
The results of this project show that a rapid index of floristic quality, in the form of Mean C of dominant plant species by cover (Cdom), is a valid tool for practitioners to use in gauging floristic quality in North Carolina’s wetlands, even in situations of low total species diversity. Mean Cdom (Mean C calculated using only dominant species by cover) performed better as a rapid index than the Floristic Quality Index (Mean C x square root of N) based on dominant species. Although Mean C does not incorporate number of species in its calculation like the traditional FQI formula does, it has the benefit of being on a closed-ended scale, making it easier to understand and compare among sites. In other words, definitions of C values exist, and make Mean C meaningful on a scale from zero to 10.
Mean Cdom was successfully able to predict Mean C of all species and was correlated with the Ohio Rapid Assessment Method, but not with North Carolina Wetland Assessment Method ratings. Removal of graminoids (difficult to identify) as a group did not appear to affect Mean C, even in herbaceous wetlands, though some wetlands were comprised of only graminoids, rendering a non-graminoid index useless in those cases. The availability of this validated cost-saving assessment tool will benefit multiple agents who are looking for faster ways of assessing wetland quality with on-the-ground measurements.
The availability of Mean Cdom or Mean Cno-gram as valid tools will increase cost effectiveness of wetland condition assessment by decreasing the amount of time required to assess a site, decreasing the level of expertise needed to calculate the index, and expediting data processing. The availability of this tool will also make it possible to assess more wetlands across the state, a real need in rapidly changing landscapes. Awareness of where high-quality wetland plant communities are clustered can help focus conservation and preservation efforts and inform permitting decisions. Also, an understanding that wetlands in the Piedmont and inner Coastal Plain, the most agricultural regions of North Carolina, show the lowest floristic quality could encourage restoration efforts focused on these areas.
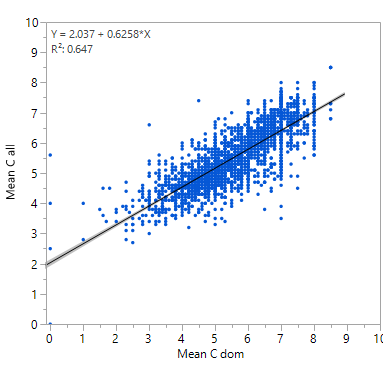
Linear regression analysis of Mean Cdom (dominant species only) with Mean Call (all species) (p<0.0001, N = 2292).
To date, two online calculators are available for using C values to calculate floristic quality indices. One calculator was developed by the Southeast Wetland Workgroup, and hosted by Research Triangle Institute, available here. C value databases developed for this project were uploaded by ecoregion to the Universal FQA Calculator website (Freyman et al. 2016). The full database from the project is downloadable here.
Floristic Quality in North Carolina Wetlands
Plant species richness across all wetland sites ranged from one to 170, with a mean of 31. Mean Call in 2,009 North Carolina wetlands ranged from 0.0 to 8.5, and it was generally lower in the Piedmont and inner Coastal Plain. Mountain wetlands and outer coastal wetlands, in general, had the highest floristic quality, along with wetlands in the Sand Hills and southeastern quarter of the state. The highest quality wetlands within this dataset included 185 Carolina Vegetation Survey sites, two National Park Services sites, and 9 National Wetland Condition Assessment plots (mean Call between 7.0 and 9.0). Shrub and herbaceous wetlands showed higher mean C than forested wetlands.
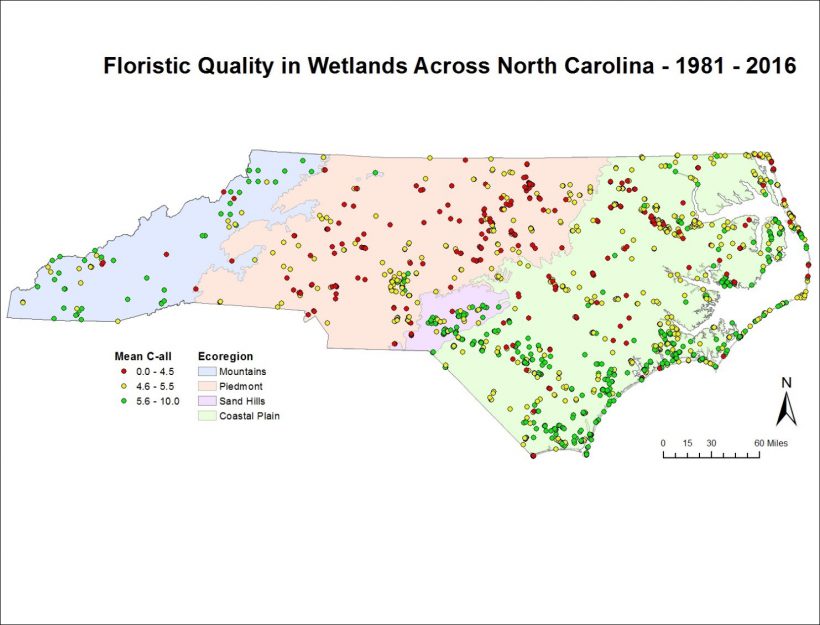
Mean C-all in wetlands across North Carolina (N=2,009, years 1981-2016)
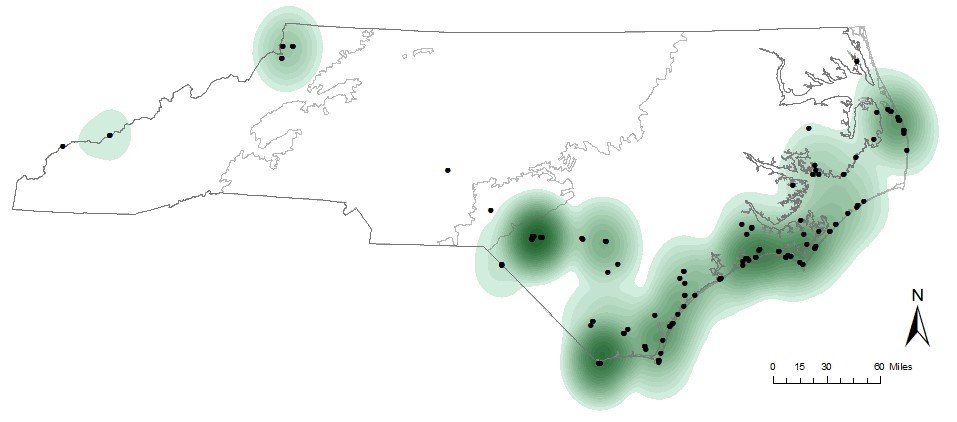
Cluster map of wetland sites with the highest floristic quality (Mean Call > 7.0) (N=196, years 1981-2016)
This work was funded under EPA Wetland Program Development Grant Cooperative Agreement CD00D51316 and matching funds from the NC Department of Environmental Quality.